
Team Performance Dashboard
Background
A retailer company named Vivian (Yes, it is named after its founder) with a Concierge team providing professional customer service through phone calls, online chats and emails.
Objective
Provide the business team with an overview of key metrics for Sales, Call Volumes, Average Handle Times, Hold Times, and # of Customer Interactions Handled.
Dashboard overview
This interactive dashboard can be accessed on Tableau public.
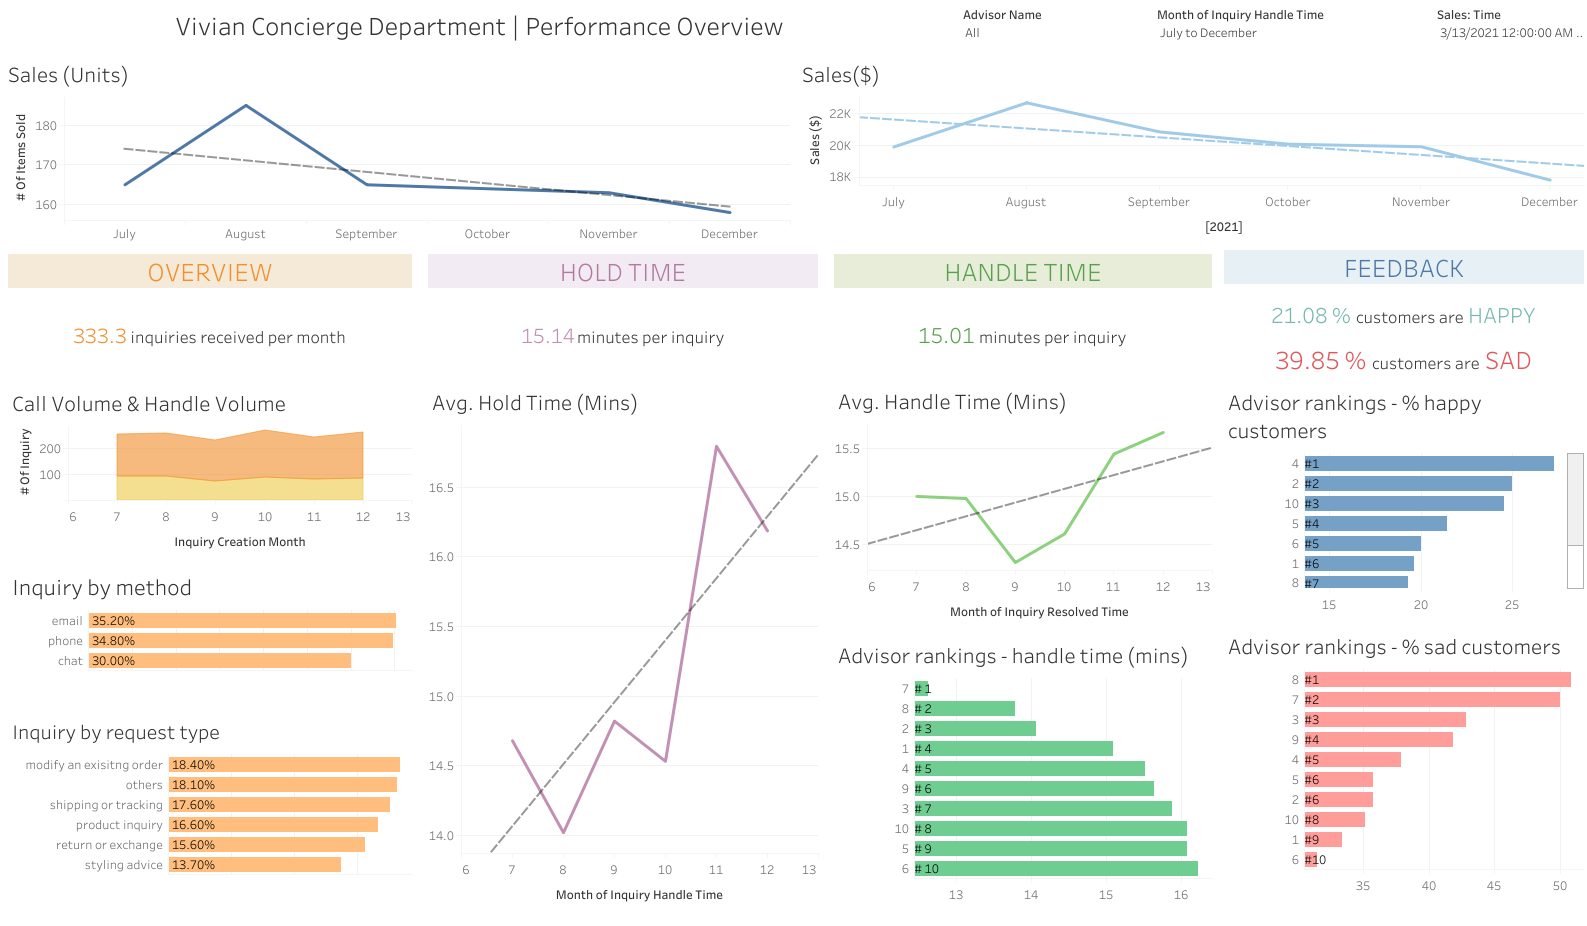
- In the title section, filters on date range and advisors’ names are added to provide capability to view data at a specific advisor’s level, whenever applicable.
- In the sales section, two sales related metrics are shown separately in two line charts, both grouped by the month an order is placed. A simulated trend line, shown as the gray dotted line, is generated to give a clear view of the recent sales trend.
- In the inquiry section, related metrics are categorized into four subsections, an overview of the inquiries, hold time, average handle time as well as customer feedback of the service. For each subsection, a representative number of each subsection is first displayed, followed by detailed chart(s) reflecting the trends/details related to each subsection, and finally, if applicable, the advisor rankings by different metrics such as handle time and customer satisfaction level. Moreover, in the overview subsection, inquiries categorized by method and request type are presented which may be useful in defining future advisor training.